




How to Monitor Intel Gaming PC Performance Accurately
Monitoring Intel Gaming PC performance helps you maintain smooth gameplay, spot issues early, and make informed decisions when adjusting settings or planning upgrades. Rather than relying on guesswork, performance data shows how your system behaves under real conditions, whether during demanding games or extended sessions. Learning how to monitor Intel gaming PC performance by tracking the right metrics and using consistent methods helps you understand what your system is doing, why performance changes happen, and which adjustments actually help.
What Gaming Performance Monitoring Shows About Your System
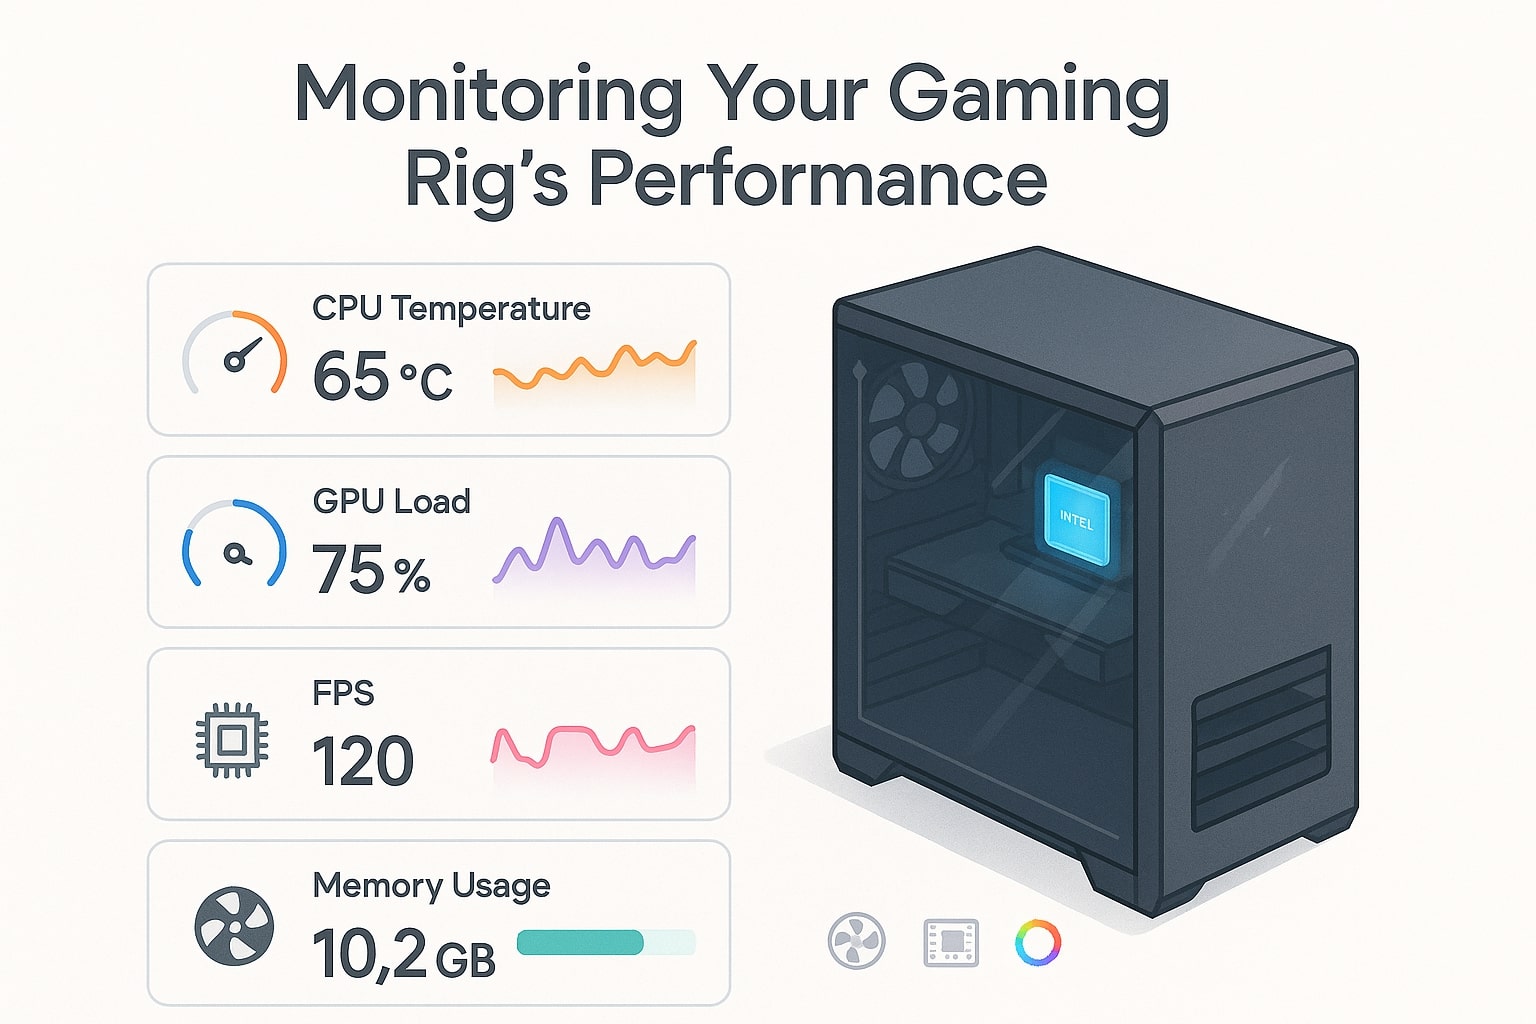
Performance monitoring gives visibility into how your Intel gaming PC responds to workload demands. It highlights whether the processor, graphics hardware, memory, or storage is limiting performance at any given moment. This information is useful not only when something goes wrong, but also when everything feels fine and you want to confirm that your system is operating as expected.
A clear baseline is the starting point. When you know how your system behaves at idle, during normal gaming, and under heavy load, you can quickly recognise changes. Rising temperatures, unstable frame delivery, or increasing CPU utilisation across similar game sessions often signal that something has shifted, such as driver changes, background tasks, or thermal buildup.
Monitoring also supports stability. Many crashes and freezes leave clues in performance data beforehand. Spikes in temperature, drops in clock speeds, or sudden increases in memory usage often appear before visible issues occur. This kind of monitoring is also useful when diagnosing bios issues, since firmware-related problems can influence power behaviour, clocks, and overall system stability without obvious warning signs.
Metrics That Matter During Gaming Sessions
Focusing on a small set of reliable metrics keeps monitoring useful rather than overwhelming. These signals cover both performance quality and system health.
Frame Rates and Frame Consistency
Frame rates show how many frames your system produces each second, while frame consistency reflects how evenly those frames are delivered. A stable experience depends on both. Large swings in frame output often feel like stutter, even when average values look high.
Watch for repeated performance drops in demanding scenes or during fast movement. If these drops follow the same pattern each session, they usually point to a bottleneck rather than random behaviour.
CPU Utilisation and Core Activity
CPU utilisation shows how hard the processor is working. Many games rely heavily on one or two cores, so total usage may look reasonable while individual cores are under strain. Monitoring per-core behaviour helps explain sudden dips in performance.
Common warning signs include:
-
One core consistently running near full capacity
-
Clock speeds falling as temperatures rise
-
CPU usage increasing gradually during long sessions
Graphics Performance and GPU Load
Graphics performance includes GPU utilisation, clock stability, and memory usage. High GPU usage with low frame rates often means graphics settings are too demanding for the target resolution. Low GPU usage paired with low frame rates suggests a limitation elsewhere in the system.
Video memory usage matters as well. When available memory fills up, textures and assets may load inconsistently, leading to hitching or visual delays.
Temperatures, Power, and Memory Behaviour
Temperatures are among the clearest health indicators. Monitoring CPU and GPU temperatures over time shows whether cooling is sufficient for extended play. Short tests may look fine, while longer sessions reveal gradual heat buildup.
Power limits can also affect performance. If power caps are reached, clock speeds may drop even when temperatures remain reasonable. Memory usage should be tracked alongside these values, since near-capacity memory often causes slowdowns tied to background processes or large game environments.
Tools and Methods for Accurate Performance Monitoring
The accuracy of performance monitoring depends on consistency rather than the number of tools or application used. Choose tools that provide real-time data, allow logging, and remain stable during gameplay.
Using Intel PCM for Detailed Analysis
Intel PCM, often referred to as a performance counter monitor, offers detailed insight into processor and memory behaviour on Intel systems. It is useful when diagnosing CPU utilisation patterns, memory throughput, and power behaviour that basic overlays may not show clearly.
For reliable results:
-
Use the same game scene or test sequence each time
-
Allow the system to warm up before recording data
-
Compare repeated runs instead of relying on a single snapshot
Real-Time Overlays for Gameplay Monitoring
Overlays allow you to see performance data while playing without switching screens. Keeping overlays simple improves readability. The most useful elements during gameplay include:
-
Frame rate and frame timing
-
CPU utilisation and clock speeds
-
GPU utilisation and temperature
-
Memory usage
Position overlays where they do not block important on-screen information. The goal is quick reference, not constant distraction.
Logging and Post-Session Review
Logs provide context when issues occur. Reviewing logs after a crash or performance drop helps identify which metric changed first. Temperature increases, clock reductions, or sudden usage spikes often reveal the cause.
When reviewing logs, focus on patterns rather than isolated moments. Repeated behaviour across sessions is a stronger indicator than one unusual spike.
Reading Performance Results and Avoiding Common Mistakes
Interpreting data correctly matters as much as collecting it. Many monitoring issues come from inconsistent testing or misreading normal behaviour as a problem.
Establish a Baseline Before Making Changes
Capture baseline data before adjusting settings. Use the same game, resolution, and scene. Record typical frame rates, temperatures, and usage patterns. Once this baseline exists, make one change at a time and compare results.
If a change improves one metric but worsens another, such as lower temperatures but reduced frame rates, the data helps you decide which outcome matters more for your use case.
Account for Display and Environment Factors
Monitor settings influence how performance feels. Confirm that your display runs at its intended refresh rate and that variable refresh options are enabled where supported. Incorrect display configuration can make performance appear worse than the data suggests.
Environmental factors also matter. Room temperature, airflow, and background tasks can change results between sessions. Keep testing conditions as similar as possible.
Know What Normal Looks Like
Not every fluctuation indicates a problem. Games load assets in bursts, and brief performance changes are expected. Concern arises when instability repeats, temperatures rise steadily, or performance degrades during the same session.
If behaviour seems unusual, repeat the test under similar conditions. Repeatable results are the foundation of useful performance analysis.
Get Help With Monitoring and System Stability
If performance monitoring highlights ongoing instability, unexpected frame drops, or temperature behaviour that does not match normal usage, additional guidance can be useful. Understanding what the data shows and how it relates to system configuration often requires experience with gaming hardware.
Ginger6 is a UK-based custom PC builder that provides technical advice and aftercare support for gaming systems built and supplied by the company. Ginger6 can help customers review system configurations, check hardware compatibility, and discuss performance observations to ensure systems are running as intended. For users looking to better understand monitoring results or plan future upgrades for a Ginger6-built gaming PC, the Ginger6 team offers practical guidance focused on stability and long-term performance.